This is a follow-up to another post of mine, to wit:
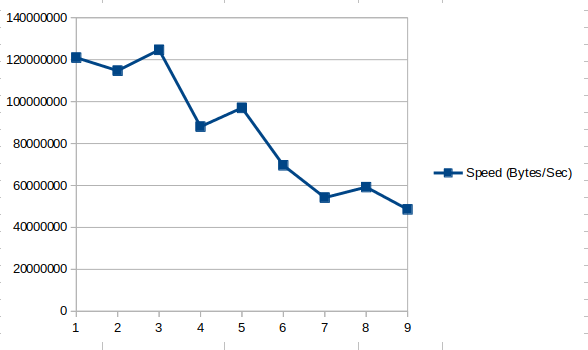
I’ve been noticing that running restic backup from exactly the same local dirtree to exactly the same repo is taking longer every day; here’s a graph of the speed (local dirtree size in bytes, divided by the time it took for the backup to run) of the last 9 executions:
I can see speed going down so much that soon enough it will be taking longer than 24 hours to do a single daily backup – which is obviously not acceptable.
The repository currently has 54 snapshots, and as I’m not currently running neither restic forget nor restic prune, it increases daily.
Question #1: Would running restic forget and restic prune periodically, say every week, and keeping just 30 backups or so, be enough to bring down and hold down this trend?
Question #2: I understand nothing can be done with the repo while restic prune is running, so I need it to finish fast. As my repo resides in Google Drive, I’m planning on starting a “n1-standard-8” (8 VCPUs and 30GB RAM) Google Compute Engine instance and run restic prune there in order to have as much high-bandwidth and low-latency as possible. Has anyone done that already? Can you share your experience, the machine type you employed, whether a preemptible instance worked for you, etc?
Question #3: I found #1348, mentioning @cbane’s prune-speedup restic tree.. Are there any other mods to restic I should consider using in order to speed my upcoming restic prune?
Is this graph referring to your remote Google Drive target?
Is this graph describing the performance of your modified restic client in which you have changed the pack size to 250MB?
Is it still true that the majority of files in your repository are never modified or deleted?
When you say that you are “running restic backup from exactly the same local dirtree” do you mean that no changes have occurred within the source, and so this snapshot is identical to the previous one?
Or is it possible that the performance differences arise from differing amounts of changed files that are being backed up each day?
For each of the 9 backups in your graph, can you provide the diff statistics? restic diff previousSnapshotId newSnapshotId | tail -7
Can you explain your graph?
I understand the Y axis to be a representation of speed (total size of source in bytes divided by “time”). Is time measured in seconds?
What is the X axis?
Can you provide this in tabular format with the raw data?
Date of backup
Source size on that day
Seconds to complete backup on that day
Added/Removed bytes on that day
Added/Removed blobs on that day
What is the current size of your repository in MB and in packfiles?
Thanks for your long, thoughtful reply, @David! Much appreciated!
This is the size in bytes of the local dirtree being backed up, divided by the time it took for restic backup to run; both taken from the following line from each restic backup output, for example:
processed 28489492 files, 2.601 TiB in 16:20:52
In the above case (for the last run, #9), the Y value plotted in the graph was (2.601*1024*1024*1024*1024) bytes / (16*3600+20*60+52) seconds = 48593586.3495 bytes/second.
Is this graph describing the performance of your modified restic client in which you have changed the pack size to 250MB?
Nope, I have not had time yet to play with the pack size yet. This is using the standard 4MB pack size.
Is it still true that the majority of files in your repository are never modified or deleted?
Yes! for example, from the same backup I took the above line:
When you say that you are “running restic backup from exactly the same local dirtree” do you mean that no changes have occurred within the source, and so this snapshot is identical to the previous one?
I mean, running with the same FILE/DIR parameter to the restic backup [flags] FILE/DIR command.
Or is it possible that the performance differences arise from differing amounts of changed files that are being backed up each day?
I don’t think so; I extracted the last lines from the ‘stats’ final messages for each of these runs, I think they tell a good story in this regard, please see here.
For each of the 9 backups in your graph, can you provide the diff statistics? restic diff previousSnapshotId newSnapshotId | tail -7
I’d love to. In fact, I tried – but after waiting for over 40 minutes for the first one to complete, I had to abort it as it was encroaching on my backup window (which, as I stated, is already critical enough):
$ date; restic diff dfd854d6 dcd11139 | tail -7; date
    Thu May 30 22:05:49 -03 2019
    ^C
    signal interrupt received, cleaning update
    Thu May 30 22:46:43 -03 2019
Do the ‘stat’ lines I posted above give you a sufficiently good look at each run stats? If not, perhaps I can try running it again on the Google Compute Engine VM I mentioned – that is, provided that there it would run in a feasible amount of time
Can you explain your graph?
Gladly:
I understand the Y axis to be a representation of speed (total size of source in bytes divided by “time”). Is time measured in seconds?
Exactly, see the example I posted above, with formula.
What is the X axis?
It’s the number of the run, ie a sequential integer starting from ‘1’ for the first run and going all the way to ‘9’ for the ninth and last run.
Can you provide this in tabular format with the raw data?
Nicely done on gathering that information! That CSV you put together probably took quite a bit of work, but it sure helps identify what’s going on.
My response below is a little orthogonal to your original inquiry, and if that’s totally unsatisfying, please let me know.
In short: The slowdown trend you are seeing (and which is illustrated in your original graph) is not caused by the growing repository size, but instead by the quantity of files changing on each day
For example, your fastest backups were 1,2,3,4 and 5. If you examine the “Added to the repo” number in your stats messages, you will see that these backups averaged 1.14 GiB “Added to repo” per backup. (1.65, 0.78, 1.24, 1.17 GiB respectively)
Your slowest backups were 6,7,8,9. These backups averaged 7.3 GiB “Added to repo” per backup. (10.0, 8.2, 3.7,7.6 GiB respectively). This is why they ran so much longer - they wrote six times more data to the repository.
Some further interesting tidbits:
This might not allay all your concerns… The data set doesn’t really provide the opportunity to measure what happens to backup speeds as the repository grows, but I think we can conclude that the effect is not nearly so significant as you first suspected. That’s good news.
However, you might still be in danger of exceeding your backup window on days when lots of data changes.
If you change the Y axis in your graph to “Bytes added per second” (“Bytes added to repo” / “total seconds for backup to complete”), you will observe that restic is working substantially faster (more bytes added per second) in the later backups.
If you change the X axis to represent “Bytes added to repo” and keep the Y axis as “Bytes added per second”, it dramatically shows that restic is working more efficiently (faster in terms of Bytes added per second) when it has more data to backup.
If I were in your shoes:
I would definitely still seek an answer to your original questions of “How can I perform occasional forget/prunes on this repository” and “what is the most efficient way to do so”. I just think it’s commonsense that you will want to run those operations occasionally.
I’d recognize that repo size management is important, but not exceedingly time-critical. I don’t think you’re in danger of exceeding your backup window due to repository size anytime soon.
I would immediately try to get some good metrics around “bytes changed per day”, as this is the most likely thing to actually cause your backup duration to exceed to window of availability.
I might explore whether you could achieve substantial performance gains by executing this backup to local storage, and then synchronize that storage to the cloud. (This is what I do!).
My response below is a little orthogonal to your original inquiry, and if that’s totally unsatisfying, please let me know.
Not a problem. It helped point me towards what has became, if not a solution, at least an acceptable work-around for the moment.
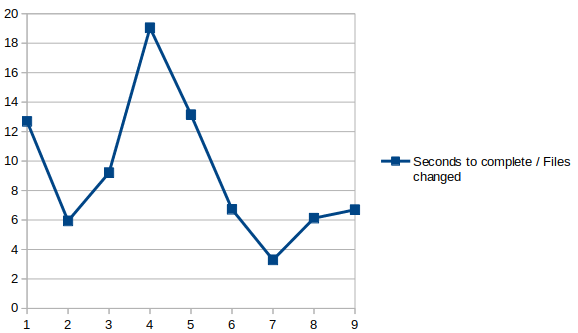
In short: The slowdown trend you are seeing (and which is illustrated in your original graph) is not caused by the growing repository size, but instead by the quantity of files changing on each day
Not sure about that; if I understand your hypothesis correctly, then we should see some definite linear correlation tendency when plotting “Seconds to complete / files changed” for each backup, which we don’t:
For example, your fastest backups were 1,2,3,4 and 5. If you examine the “Added to the repo” number in your stats messages, you will see that these backups averaged 1.14 GiB “Added to repo” per backup. (1.65, 0.78, 1.24, 1.17 GiB respectively)
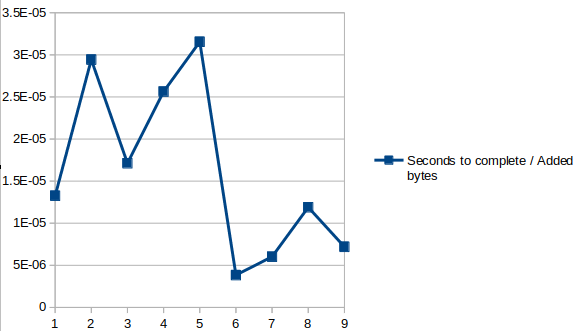
Oh, OK: from the above I gather you are not referring to the “Bytes added to the repo resulting from the new/changed files”, and not literally to the “quantity of files changing” as I understood at first; Let’s graph that too (seconds to complete / Bytes added to the repo):
(BTW, no need to refer to the stats messages, the “Bytes added to the repo” was already in my CSV file as column F).
So, at least graphically, it doesn’t seem to be correlated either.
Your slowest backups were 6,7,8,9. These backups averaged 7.3 GiB “Added to repo” per backup. (10.0, 8.2, 3.7,7.6 GiB respectively). This is why they ran so much longer - they wrote six times more data to the repository.
This is indeed the case, but it could be coincidence as your hypothesis seems to be contradicted not only by the above graph, but also by some individual observations like the fact that backup 7 was the longest at 55% more “seconds to complete” than the second-longest, which was backup 6, but the latter added ~10.7GB to the repo, while the former added almost 20% less at 8.8GB.
Another factor that helps disprove the “more bytes” explanation is that I have a 50Mbps symmetric internet link for the backup – but (after the initial restic backup) its upstream utilization never goes beyond 10Mbps. And in fact, 10.7GB / 41115 secs * 8 = ~2.1Mbps, so the “more bytes” could hardly be an explanation, at least in terms of effectively-used upstream bandwidth.
OTOH, this backup’s duration seems to have stabilized around 14h – hardly comfortable, but at least it’s not in imminent danger of exceeding my roughly-24h backup window, so I think I have more time to finally solve that.
Some further comments:
I would definitely still seek an answer to your original questions of “How can I perform occasional forget/prunes on this repository” and “what is the most efficient way to do so”. I just think it’s commonsense that you will want to run those operations occasionally.
I think I will post another topic regarding that, as this one has strayed far and wide from its original intention
I might explore whether you could achieve substantial performance gains by executing this backup to local storage, and then synchronize that storage to the cloud. (This is what I do!).
[/quote]
The problem with that approach is that I don’t have enough free local storage for that, and besides I’m not very happy in adding another stage to that cloud backup (I already have a first stage where the backed-up datasets are sync’ed by zfs send|recv from the main server to the backup server, where I run restic to back it up to the cloud).
Your CSV file has an error for the duration of run #4. It should be 31660 seconds, not 32315.
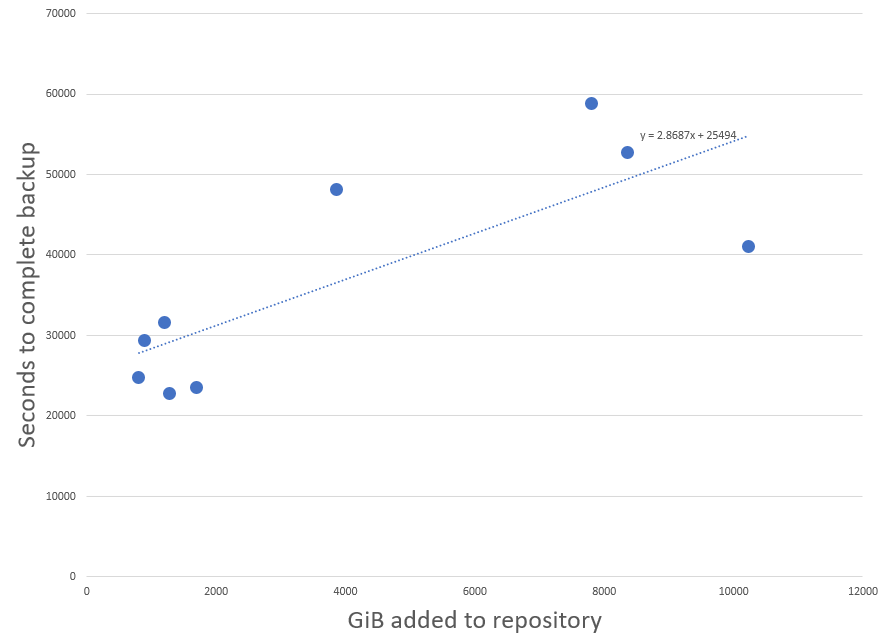
If your goal is to test the theory that there exists a relationship between “bytes added to repository” and “seconds to complete backup”, (and I think that’s a promising question to answer!), I recommend a linear regression between those two variables. The graphs you are posting all use “run #” as the X axis, which is unrelated.
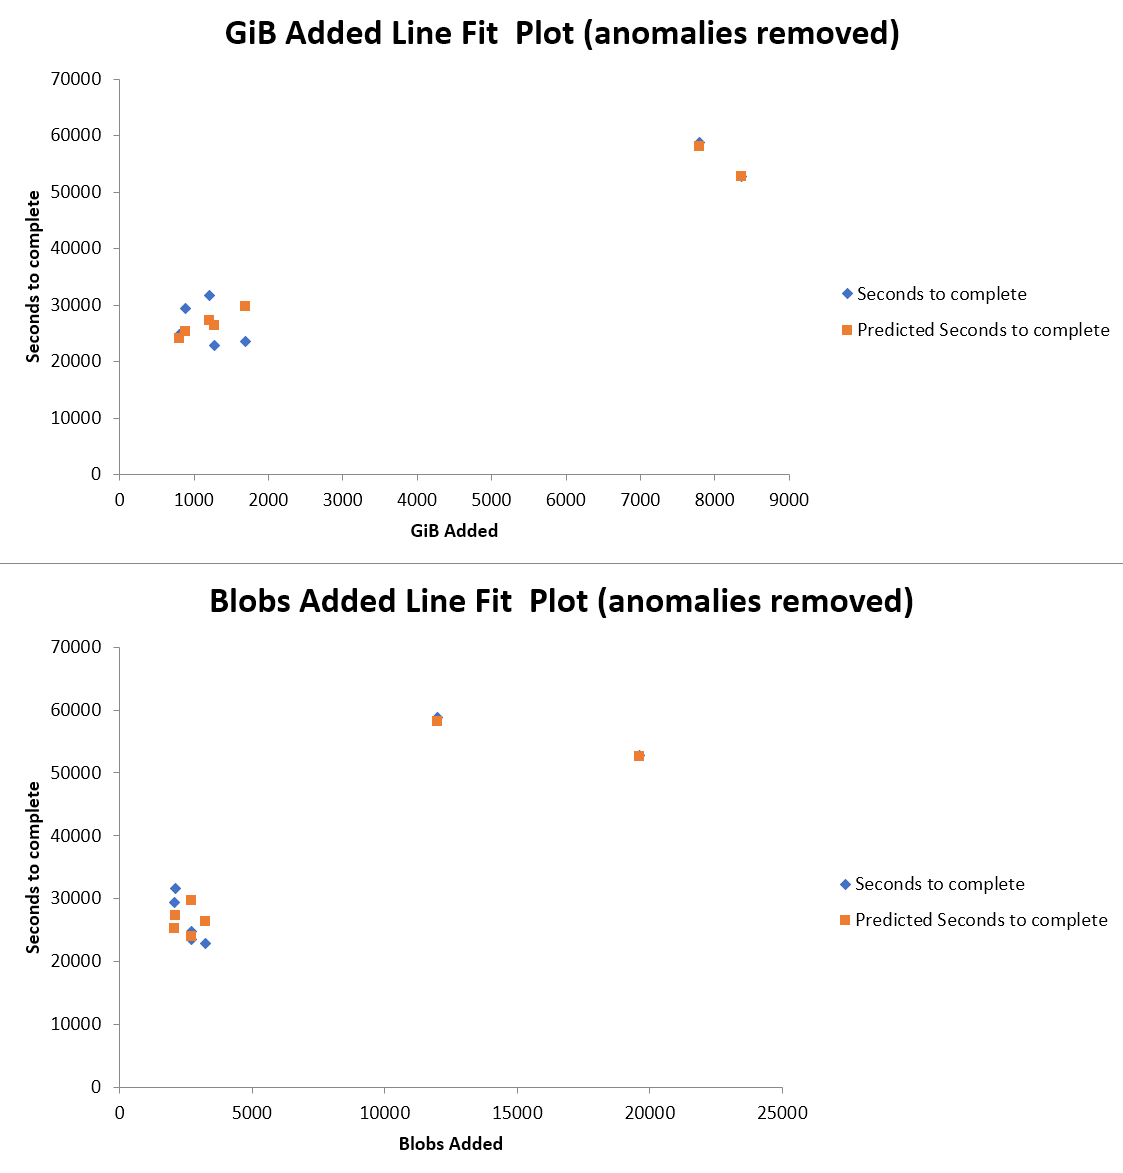
I went ahead and ran that regression, and found a correlation between “bytes added to repository” and “seconds to complete backup”, which common sense suggests should be related. The best-fit line is: SecondsToComplete=2.87*GbytesAdded + 25494. This suggests that there is about 7 hours of overhead in the process (presumably scanning your storage and comparing it to the repository , etc) followed by a variable amount of time to add the new/changed content to the repo.
This formula has an R2 of 0.62, which is only moderately predictive. Of particular note are runs 6 and 8, which are anomalous. Without these runs, the model has a R2 of 0.9, which is strongly predictive.
You might want to research those runs to see whether there are externalities which could explain their differing performance. Also, I recommend that you update your CSV with the results from more recent backups so that we can test their fit to this trendline.
I would suggest considering instead a relationship between “blobs added to the repository” and “seconds to complete backup.”
Note that the memory consumption of restic appears to increase linearly with the number of blobs (not files) in the index. My suspicion is that most operations in restic are more sensitive to the number of blobs rather than the number of files, and comparing the two you would see a stronger correlation to the number of blobs.
The number of bytes may also correlate, but I still suspect a stronger correlation with number of blobs.
I did a multiple linear regression using both blobs and bytes, and both of them failed to perform very well when backups 6 and 8 are included. Blobs did a little better when these backups are included (but only slightly). These are definitely anomalous. Something external (neither bytes nor blobs) was causing restic performance to vary on those operations.
When we remove those backups from the data set, both bytes and blobs performed very well at predicting the backup duration, although bytes performed a bit better.
I’ve checked my log files for backups 6 and 8 and saw nothing too different from the others. It could be something that wouldn’t show up in the logs, like some bottleneck in the Internet between my backup server and Google Drive servers.
Anyway, backup times keep increasing here: I don’t have the time to go though a full data collection job again, but the latest (finished yesterday) took almost 19h to deal with a volume of changed/new bytes/files/blobs not too different from the others we’ve depicted before:
 Files:        1289 new,  2251 changed, 28527929 unmodified
 Dirs:            0 new,     0 changed,     0 unmodified
 Data Blobs:   1975 new
 Tree Blobs:      1 new
 Added to the repo: 523.134 MiB

 processed 28531469 files, 2.615 TiB in 18:46:34
At this rate, it will not be long before my backup window is overwhelmed
Therefore, as so far I wasn’t able to get the info I need on running restic prune in a GCE VM against a GCS repo, I’m sticking with what I know and I’m right now copying (with rclone sync) the repo from its GDrive directory to a new one also on GDrive, onto which I will then run restic prune; when the prune is done, the plan is to just rename the GDrive repo directories, eg rclone moveto gdrive:restic_repo gdrive:restic_repo.old && rclone moveto gdrive:restic_repo_PRUNED gdrive:restic_repo.
This will take about 20 days to complete just for the initial rclone sync (due to the damned GDrive 750GB/day server-side limit) and then I will have to run at least another one to copy the files that my daily restic backup jobs keep creating in the meantime, and an unknown time for the prune, but at least I’ll not have to copy the pruned dir back to GDrive, and also I won’t be stuck with a potentially very expensive GCS bill for those 15 TBs during who-knows-how-many-days in the meantime…
Right now I’ve also got another problem, which is my restic cache directory reaching 600GB(!), and restic cache --cleanup being unable (or unwilling ) to clean anything up – going to post a separate topic for that.
I’d like to see the data before commenting on the overall trend, but certainly the stats you posted just now are running much slower than anything else you’ve shared.
Actually, this was the smallest backup set you’ve ever shared (in terms of added bytes & blobs), and it ran 243% longer than the second-smallest backup set.
Is this a sufficient response for your situation? Have you considered the use of local storage to help?
You bet. They have been going steadly worse, along with memory consumption during backup, as the repo grows with more snapshots, but this is not a big surprise as @cdhowiehad already more or less predicted it.
You are correct. I meant to say, ‘in terms of magnitude’: among the ones we’ve depicted, both #2 and #5 are in the “several hundreds of MBs added” order-of-magnitude ballpark, ditto ‘few thousands of changed/new files/blobs’, but had taken considerably less time to complete (specially #2, which I think not coincidentally, is the earlier one).
My point is that things seem to be going steadily downhill independent of how much the source data files have changed. The only thing I can see that could account for that is repo growth. and this seems to be implied by my previous exchange with @cdhowie (pointed above).
The only solution I can see for this is as many forgets as possible, followed by a prune: given that I will do the prune on a copy of the repo and keep the old, pre-prune repo around, my idea is to forget everything but the latest snapshot for each of my dataset; if I ever need to restore anything from an old snapshot, I can access it from the previous repo I will be keeping.
Let’s hope I have enough time for that before things blow up in my face – despite the top-notch hardware I’ve dedicated to restic in the form of its own exclusive Xeon server, it seems to be busting at the seams at too many places (not only backup time window, but as previously stated, also memory usage and cache size) – I’m starting to get the impression that restic is simply not ready for the kind of load I’m putting on it Well, if it breaks, at least I get to keep both pieces
Can’t afford it right now: the dedicated restic server I mentioned already has a set of 10TB disks for receiving the ZFS snapshots from the main server (and it takes than less than 30 seconds each day to sync the same data that restic struggles for hours on end to back up to the cloud).
Perhaps I will be able to buy more storage in a few months… hard to justify as it kinda defeats my entire plan on using restic, which was to backup as directly as possible to the cloud – the dedicated server was already a late addition to the plan, when it became clear the main server did not have enough RAM for the task. It’s going to be hard to justify adding another step (and more hardware, and more money, and more complexity) to my already complicated (and expensive) backup procedure by having it write to local storage first and then use rclone to copy it to the cloud.
Thanks again for your help and interest,
– Durval.
Hummrmrmr… from previous conversations with @fd0 on the IRC channel, I was under the distinct impression that changing --transfers and/or --checkers would accomplish nothing, because rclone operates in an entirely different manner when in serve restic mode.
I’m not so sure (or prejudiced ) about the --fast-list option, but the fact that the rclone server restic doc page doesn’t list it along its options either, makes me believe that is indeed ignored in this mode.
Do you have information and/or experience otherwise? @ncw, if you are around, would you please give us some authoritative info on whether rclone serve restic considers any options besides the ones you listed at the doc page?
That is more or less correct. --transfers and --checkers control concurrency within rclone and are mostly used when doing rclone sync. However if you use, for example, --fast-list with the google drive backend then --checkers will control the concurrency of that.
--fast-list doesn’t do anything with the restic backend. Rclone will use it internally where possible (which depends on the backend).
Potentially some of the other options will do things, but I don’t think they will be needed. The backend options may be useful though and can be used.
@ncw, thanks for your long and thoughtful response.
I just reviewed the gdrive backend doc and unfortunately I don’t see any options that could help optimize for my current situation
I hope my “rclone copy + (N-1)restic forget + restic prune + switch repo dir” strategy works. The initial rclone copy is about 40% ; The last backup took over 21h (!), in less than 3h more it will overwhelm my backup window. So it’s a race between rclone copying the repo so I can forget+prune+switch and the ever-growing duration of restic backup… hope rclone can win this race for me.
Reading this thread was quite exciting! I’m itching to know: @durval, did it work? Which process won? I’ve been looking for answers to changing the pack size, as I just backed up ~7TB and have 1.4 million files. Seems like quite a few.
Anyway, thanks for the read, I hope you got your problem worked out!
Please note that with 0.12.0 the prune command is much faster and now mainly depends on the number/size of pack files it really does repack. And this can be now controlled by the additional option --max-repack-size.
So IMO the strategy to optimize pruning should be now to simply play around with the options prune is offering.


 ) to clean anything up – going to post a separate topic for that.