We are testing a large restic restore (67.662 TiB according to “restic stats”). This is being done over 10Gb Ethernet and the restic restore target has 128GB RAM, running a variation of Ubuntu 20.04 LTS. No other work is being performed on the restore target…only “restic restore” is running and pretty much all I/O is connected to that job. The restic repo is physically on a different box running REST server.
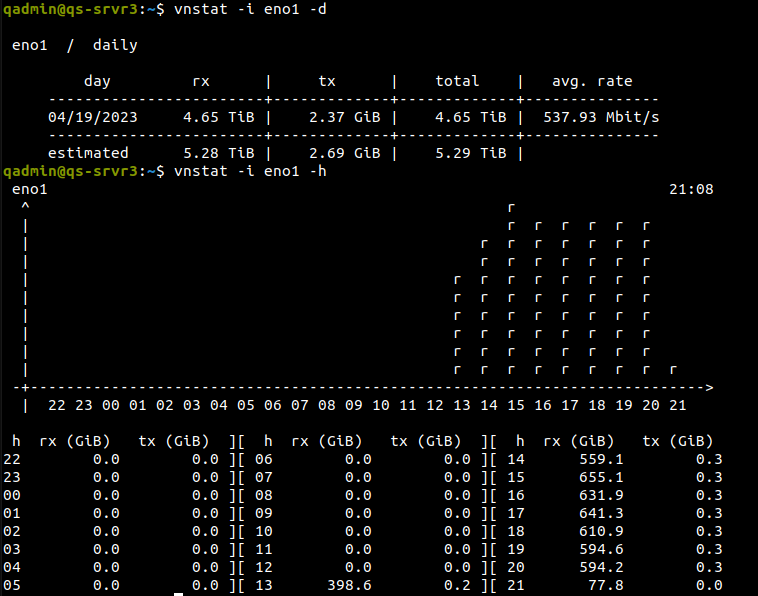
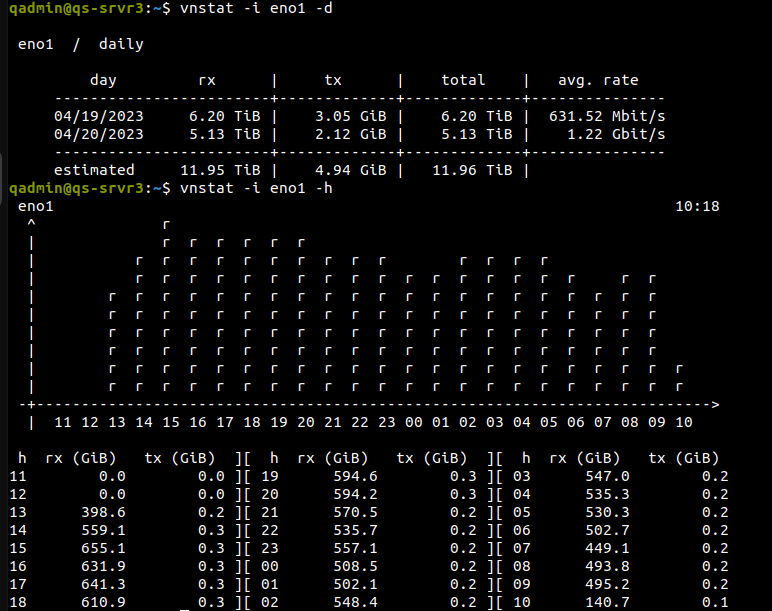
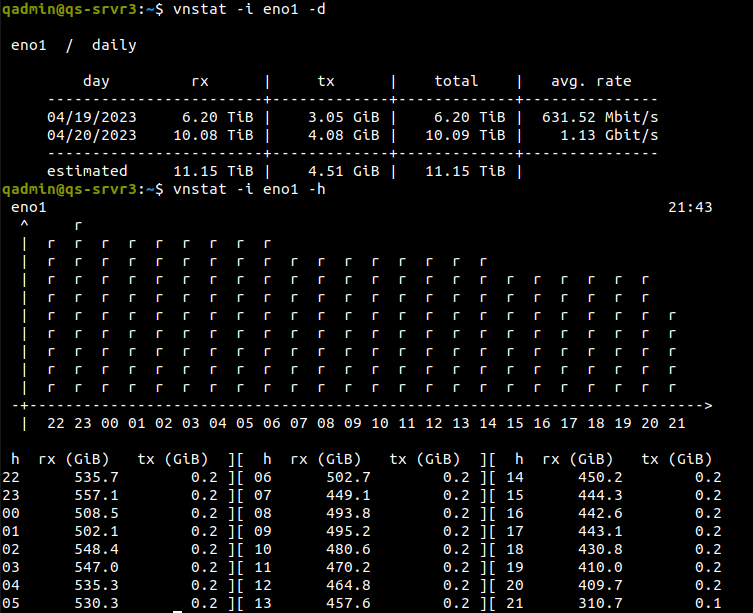
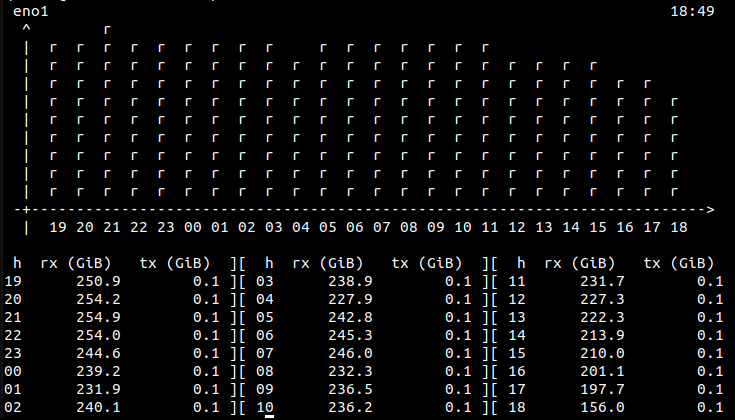
We are using vnstat to track rx incoming data on the “restic restore” target. At the start, it all looks pretty good as seen below.
I don’t have a way to track the growing disk utilization on the target but I know it’s increasing and of course I don’t want to interrupt the running “restic restore” process. Swap is holding steady at 7.0M. What are we observing here with this degradation of rx? Is this normal for restic 0.15.1 during long, multi-day restores? Perhaps part of the restore process or bug?
I don’t think there’s a lot of experience in running restore operations of this size. Judging from the code there’s no obvious reason why the restore should slow down over time. The restore command first plans the whole operation and then restores data from one pack file after the other.
However, there are a lot of reasons why a restore could slow down:
Different file sizes: restoring larger files generally restores more data in the same time than with smaller files
Backup fragmentation: there’s some research that deduplicated data storages tend to fragment over time (aka. the data in a snapshot is spread across more pack files than necessary)
Varying IO performance of the repository storage or the restore destination
Filesystem getting slower with increasing storage size
(Maybe) Memory fragmentation in restic?
Some other things I didn’t think of.
Is there a change in CPU/IO utilization (especially disk IO times / utilization) over time? How does the memory usage of the restore process evolve?
I do believe I can echo this report, with a 7.5TiB snapshot restore. It starts off fast but slows down dramatically over time. Mine is over a local USB connection, though.
I’m actually running it right now - and have been for the past 14 days. But I need it to finish, and didn’t log any historical speeds to more thoroughly add to this report. But speeds started in the 80-120MB/s range and are now more 8-12MB/s.
I was just thinking since it’s a large snapshot, with many thousand files in each folder, it was inherently going to slow down since I’m restoring to a spinning disk. In my case I think the folder enumeration is what is slowing it down, but after reading this report perhaps there’s more to it?
It’s also worth noting if it’s an SMR drive as well - which mine is. But it isn’t thrashing, really. As far as I can tell, Restic itself has just slowed down over time. If I do a second restore to the same disk at the same time, it takes off at 60-80MB/s. So I don’t think it’s the SMR’s fault.
EDIT: After the weekend, it’s more in the 1-2MB/s range. Still about 1TB to go…
I’m replying to my own post to report the results of the large restic restore job.
After 7 days the job ended.
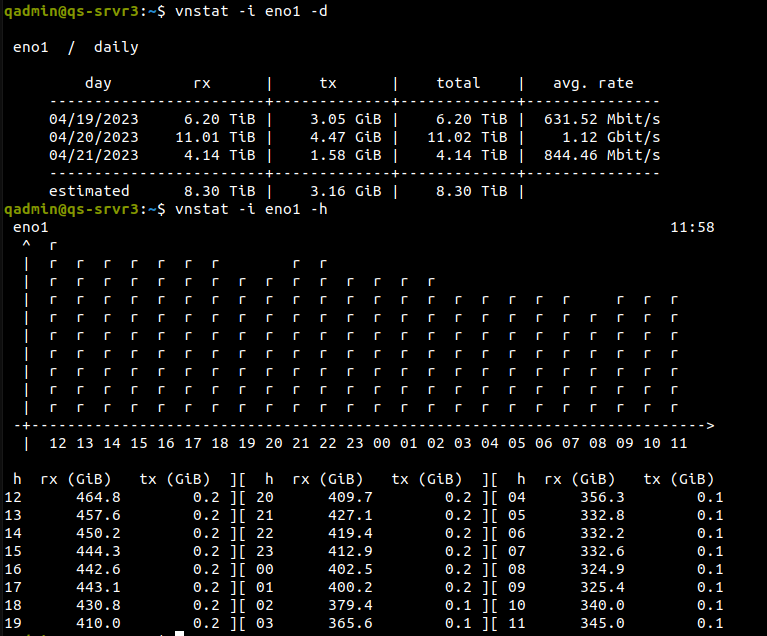
Rx speed continued to decline. Noticeable rate drop almost every few hours. Nearing the end of the job the histogram looked like the image attached to this message.
This shows the range at about 200 GiB per hour and continuing to fall. If the job continued for a few more days then I don’t know if this would eventually bottom out.
At the end of the restic restore command I saw a number of “ignoring error for”…“StreamPack: context canceled” messages for some of the restored files. “echo $?” produced a return code of 0 so I’m guessing that these StreamPack messages were just warnings.
While the restic restore job was running we also ran a separate rustic (@alexweiss) restore job on a separate set of hardware. This rustic restore job was restoring from another REST server which had a copy of the same snapshot that the restic restore job was using. Rustic was able to maintain a very consistent 400 GiB+ restore on the rx every single hour. This is about double the speed of restic for this type of restore operation. We believe that rustic would have posted even better numbers but the REST server that we used to serve rustic was suffering from multiple ZFS resilver events thus bogging down the overall speed.
@MichaelEischer During both the restic and rustic tests I didn’t have any utilities/tools to monitor CPU/IO utilization and memory usage over time.
In the medium to long term we would like restic to succeed but at the moment (short term) rustic appears to be doing a much better job at restoring sizable snapshots at a consistent rate of speed.
Anyway, any suggestions that anyone can offer would be immensely helpful.
I don’t mean to say that the difference you have observed is inaccurate, but when the test you have performed haven’t been a reproduction with the very same components, it’s not really enough to establish much. The very same test should be run the very same way on the very same hardware and networking, in both directions (that is, using restic where you now used rustic, and vice-versa).
@kalleyne If there is this speed difference between rustic and restic, I cannot really explain that. Both use almost the identical algorithm to actually do the restore. So my best guess would be a difference due to the language used (Rust vs. Go - maybe memory issues in Go like too much/costly garbage collection) or in the http client packages used (rustic uses the very common reqwest crate).
I’m however wondering a bit about the maximum transfer rate you would expect. 400 GiB per hour is pretty close to a 1Gbit connection, but you wrote you have a 10Gbit connection which would mean only 1/10th of the given bandwidth is used.
One difference in rustic is that currently each blob is requested in a single request whereas restic (IIRC) requests parts of a or a full pack file and processes all contained blobs in a row - but this would rather explain why rustic is slow.
I’m about to improve the restore performance of rustic - if you are interested in discussing or testing this, I think the rustic Discussions is the suitable place to do.
@alexweiss Yes, we have the same concern. I don’t recall a situation where we used “restic/rustic restore” and seen network throughput faster than this. Generally, the volume of disk writes would be higher than incoming rx network data so we believe this is related to the compressed/deduped data transmitted over the wire and then extracted when writing to disk. Restic/rustic appear to be using a fair amount of CPU when processing. We think that older CPUs with fewer cores are more problematic but we don’t know for sure if there are restic/rustic optimizations for AVX2 and AVX512 as seen on newer CPUs. As the restore process is relatively CPU heavy and the fact that we are using a limited number of rotational hard disks (and not SSDs or NVMEs) on the REST server end and on the restore end…these may all conspire to barely fill 1/10 of available network bandwidth. And of course, the simultaneous ZFS resilvering didn’t help.
Some months ago, I remember seeing network throughput around 2Gbps when we were testing “restic copy”.
Back in 2019, we used “restic mount” and msrsync with multiple workers to copy data and while speeds approached 400 GiB/hour…I don’t think we exceeded that speed. Today, I would try to avoid “restic mount” as I believe that it consumes a lot of RAM with very large repositories. Correct me if I’m wrong in my thinking.
Anyway, we would be genuinely interested in real-world examples of people seeing full 10Gbps throughput during “restic/rustic restore” operations.
Internally, we are not setup to perform heavy duty benchmarking over a protracted period of time. However, we are interested in seeing performance improvements to “rustic restore” in the field. So, yes, thanks…I’ll take you up on your offer and join you over at rustic Discussions.
The (expected) main contributors to the CPU usage are AES decryption (accelerated using AES-NI), SHA256 calculations (hardware acceleration is available on somewhat recent AMD CPUs via the SHA-NI extension. No idea whether Intel supports it) and decompression (shouldn’t limit the throughput). The main throughput limit are probably the SHA256 hash calculations. Although a somewhat recent CPU should still manage a throughput of 50-100MB/s.
What about the CPU usage at the rest-server? Does the connection between restic and the rest-server use HTTP/1.1 or HTTP/2?
The code paths of the restore command share a significant amount of code with the copy command. I’d expect both to behave somewhat similar.
There are very limited tests with multi Gbit transfer rates. I’m only aware of these tests for the backup command https://github.com/restic/restic/pull/3731#issuecomment-1207391053 (before restic 0.14.0).
By construction, mount is expected to be (much) slower than the restore command, as files have to be processed sequentially by restic instead of in an optimized order as determined by the restore command. For both commands, the majority of the memory usage should originate from the repository index which is used in both cases.
I’m not too sure how to check the connection between restic and the rest-server. Would I do that by capturing verbose output or debug log of some sort? I’m not using any nginx, Apache, Caddy or reverse proxy specifically designed for HTTP/2 if that is what you mean?