With the 0.9.5 release we can now stream JSON output during backup operations. I had a quick play with my ‘TIG’ stack at home and was able to display some interesting metrics very easily.
I’d be curious to know if anyone has done anything similar/better as I’m little more than a beginner with such things.
In my case I only export stats from restic stats, duration and exit codes to prometheus (with node-exporter’s textfile collector). So I can have a dashboard and alerts (if the backup size drops more than some percent, if it didn’t run last night…).
I use jq to format restic stats’s data: stats --json latest | jq -r '"restic_stats_total_size_bytes \(.total_size)\nrestic_stats_total_file_count \(.total_file_count)"' > restic.prom.
and for the snapshots: snapshots --json | jq -r 'max_by(.time) | .time | sub(".[0-9]+Z$"; "Z") | fromdate | "restic_stats_last_snapshot_timestamp \(.)"' >> restic.prom
Very nice… as an absolute Grafana newbie (i.e. I just got it running a few minutes ago)… any pointers you can give as to how you configured the queries, and what source you are using? Are you pulling with telegraf, or direct to Grafana somehow?
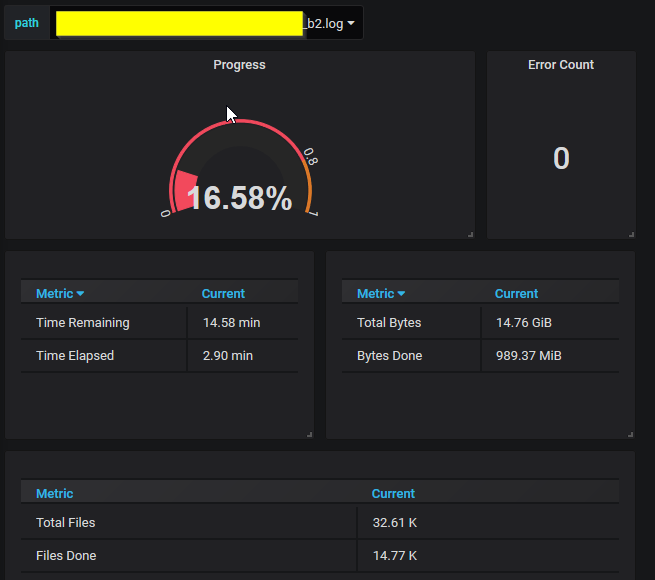
I’ve also created a dashboard based on parsing the backup --json output after every job. With the newest version the json summary output of restic backup --stdin is also fixed. I generally take the last (sometimes i get multiple) summary result (of the backup job) and simply transform the json object into the influx line protocol.
These are just very basic influx queries and very easy to create using the graphical query builder.
But here are some examples:
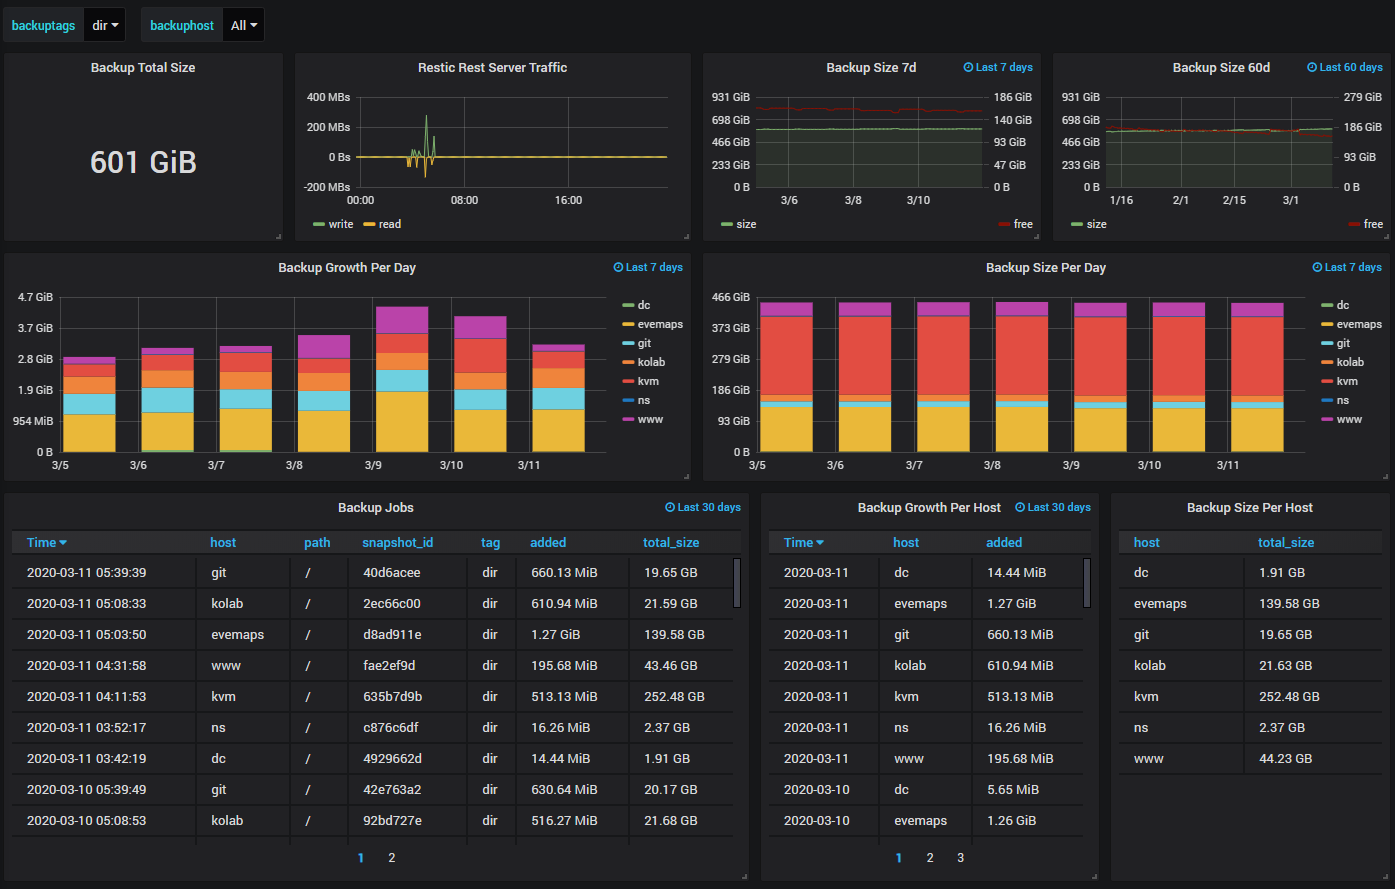
# Backup Growth Per Day
SELECT sum("data_added") FROM "jobs" WHERE ("host" =~ /^$backuphost$/ AND "tag" =~ /^$backuptags$/) AND $timeFilter GROUP BY time(1d), "host" fill(null)

# Backup Size Per Day
SELECT sum("total_bytes_processed") FROM "jobs" WHERE ("host" =~ /^$backuphost$/ AND "tag" =~ /^$backuptags$/) AND $timeFilter GROUP BY time(1d), "host" fill(null)

# Backup Jobs Table
SELECT "data_added" AS "added", "total_bytes_processed" AS "total_size" FROM "jobs" WHERE ("tag" =~ /^$backuptags$/ AND "host" =~ /^$backuphost$/) AND $timeFilter GROUP BY "host", "path", "tag", "snapshot_id" ORDER BY time DESC

# Backup Size Table
SELECT sum("total_bytes_processed") AS "total_size" FROM "jobs" WHERE $timeFilter GROUP BY "host" ORDER BY time DESC
Very simple queries. Not a single query needed to be done in raw sql mode. Hope that helps
# ensure there was 1 backup in the last 24 hours
absent(restic_stats_last_snapshot_timestamp) or (time() - restic_stats_last_snapshot_timestamp) / 3600 > 24

# ensure there was 1 snapshot in the last 24 hours
absent(restic_last_run_timestamp) or (time() - restic_last_run_timestamp) / 3600 > 24

# alert if total size drop by more than 10% since yesterday
absent(restic_stats_total_size_bytes) or restic_stats_total_size_bytes OFFSET 1d - restic_stats_total_size_bytes > restic_stats_total_size_bytes OFFSET 1d * 0.1

# alert if file count or total size doesn't change
absent(restic_stats_total_size_bytes) or rate(restic_stats_total_size_bytes[1d]) == 0 and rate(restic_stats_total_file_count[1d]) == 0
I’ve created restic2influx which feeds the restic status output into influxdb and allows you to visualize statistics from previous backup runs as well as the live status of currently running backups. Feel free to give it a try:
these dashboard are really great.
My setup is a bit different as I run a rest-server with restic and have different machines make backup to the rest-server.
Is there a way to centrally to fill the influx from the rest server?
Can the rest server also provide the statics of the different repositories ?
I also run the pruning on the server , so the repository passwords are known by the pruning scripts. By that i could also add some new scripts to collect statics fro the individual repositories.
Does some has similar setup and already has some scripts by hand?
@Alexandr-Falcon99 yes I use librenms for the entire server, where I run most things in docker.
rest-server with additional
prometheus
node_exporter
pushgateway
grafana
but also:
minecraft x3
photoprism x2
immich
backrest
rocketchat
jellyfin
syncthing
librenms
Librenms monitors the physical server overall cpu/network/memory/disk usage and things like temperature, voltages, fanspeed. I also have it monitor my NAS which i use as dumb storage.
The rest-server example dashboard: https://github.com/restic/rest-server/raw/master/examples/compose-with-grafana/screenshot.png
gives blob/data/index/keys/locks/snapshots read/write/delete throughput or operations. Most of these manifest themselves into regular cpu/network/disk usage.
For me the most added value comes from having alerts i.e. via LibreNMS (disk runs out of space, machine is down) or via “healthchecks.io” which alerts me if a machine does not respond to an hourly ping or backup job has not run or backup job has run with an error status.
Automated backup is golden, but useless if you run it without proper monitoring or without knowledge that you can successfully restore the backup.
@GuitarBilly Lol… LibreNMS, i’ve developped a lot for this one a couple of years ago (the exec library is from me, and the wrapper is a full rewrite of me). Still running LibreNMS since it’s the best opensource solution I found so far for deeper network diagnostics.

