Computing the size of each snapshot is a very time-consuming process since each tree must be visited to determine how large the snapshot is. Doing this for a list of a hundred snapshots would probably take an hour or so.
Ok, thanks that bit I did not know. Will do with the individual stats then.
I found a solution to find space will be freed if a snapshot were removed.
1- Run restic prune --dry-run
2- Take note of sum “total prune” and “unused size after prune”
3- Run restic forget snapshotid --prune --dry-run
4- Take note of sum “total prune” and “unused size after prune”
5- The difference between the sums is the space will be freed if a snapshot were removed.
@fthdgn Thanks for the info!
Should be available easily for all backups made starting with v0.17.0 and later: Store snapshot statistics & print snapshot size by MichaelEischer · Pull Request #4705 · restic/restic · GitHub
Wow that’s great news. Is there a timeline for 0.17 already? So far, I ran these four (time consuming) commands after each backup to gather statistics and store them:
restic stats --json --mode raw-datarestic stats --json --mode raw-data latestrestic stats --json --mode restore-sizerestic stats --json --mode restore-size latest
From these some statistics can be derived but the linked pull request provides much more. Thank you!
restic 0.17.0 will still take some time (probably 2 months or more), I’m only halfway through with the planned features.
I’m running 0.17.3 but no size column when i use restic snapshots ![]()
What am i doing wrong?
Edit: Restic changelog for 0.17.0:
The
snapshotscommand now prints the size for snapshots created using this or a future restic version
That explains it.
@FunctionDJ i guess you updated restic but did not make a new backup. This new feature works fine with 0.17.3, albeit that all backups made with prior versions <17.0 will show no data in the size column as there is no data stored in the repository.
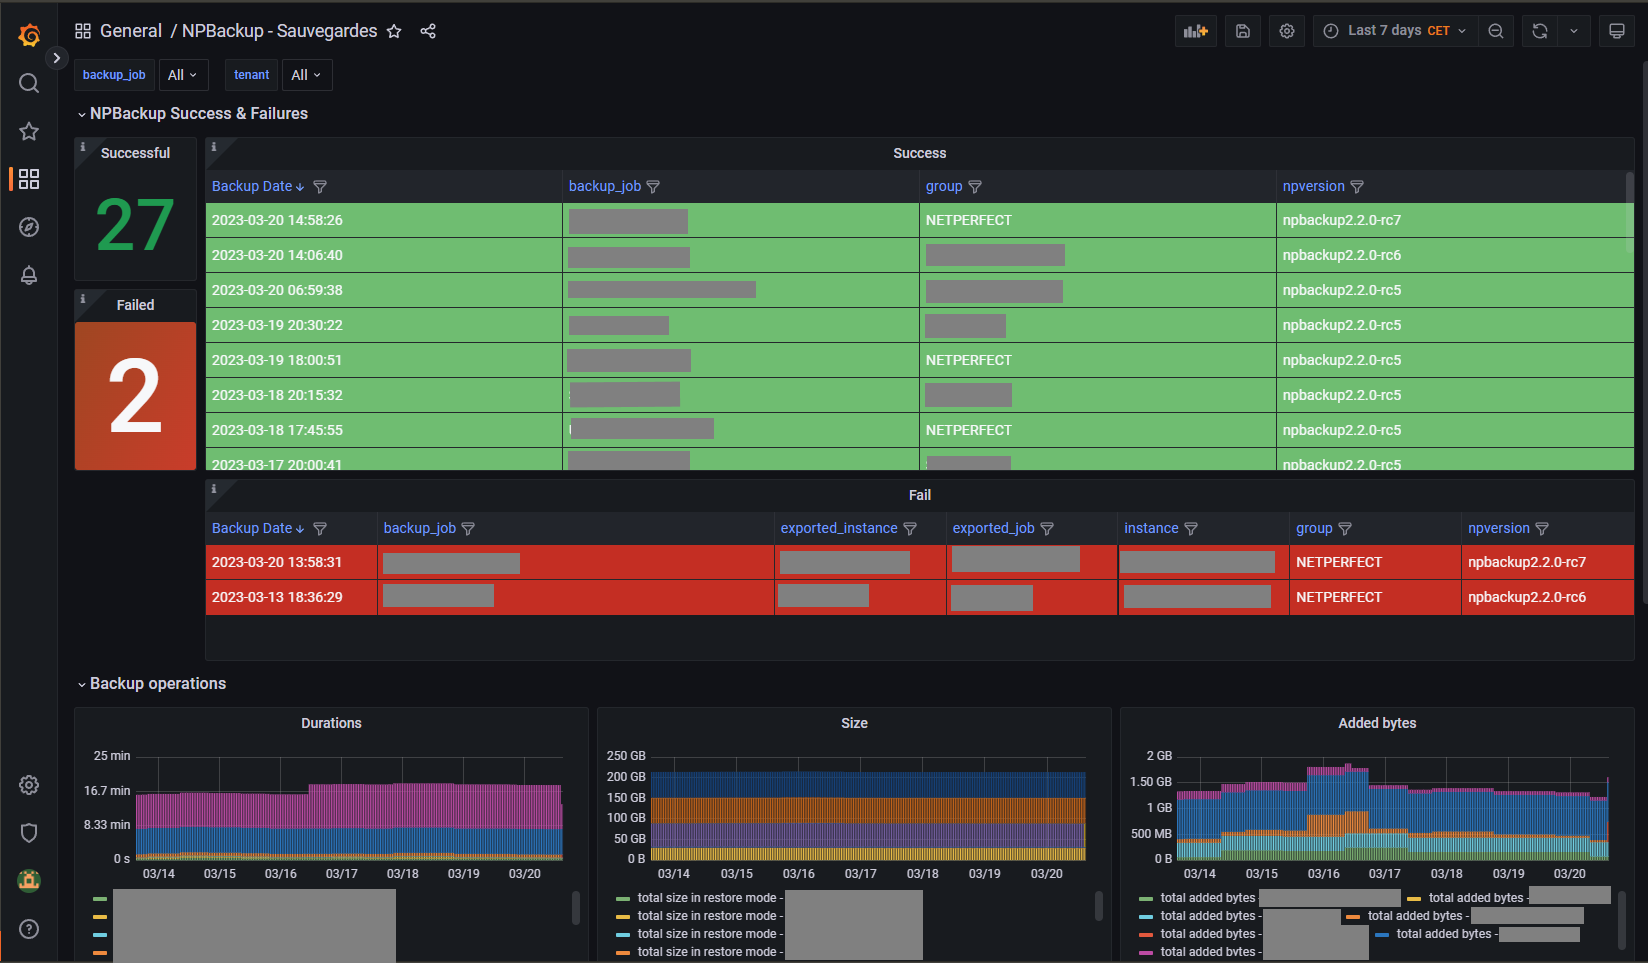
Going back to the original question, one can also achieve snapshot size information (“how much storage my snapshots are taking”) if you set up metrics monitoring. For example with Prometheus and a Grafana dashboard.
There are various tools who can help with that, including rest-server. Some solutions are already discussed on this forum:
Then you can get something like this example, the npbackup dashboard:
p.s. Also metrics monitoring will not generate/show data for backups made in the past.
I think restic stats is somewhat useless because of deduplication. You’ll need diff between snapshots.
EDIT: I asked something almost similar about btrfs snapshots a while back: Best way to show/visualize btrfs disk usage? - Unix & Linux Stack Exchange to which my answer was to write pmorch/btrfs-snapshot-growth. Perhaps one could refactor that to deal with multiple kinds of “snapshots” including restic’s ![]() .
.
Compare these two scenarios:
Scenario 1 repeated backups of the same files
- Init repo
- Create 1GB of random data in /some/folder/file
- Backup /some/folder
- Backup /some/folder again
Both snapshots will show 1GB size and the total repo size will be 1GB.
Scenario 2 backups of the same folder but with different files
- Init repo
- Create 1GB of random data in /some/folder/file
- Backup /some/folder
- Create 1GB of other random data in /some/folder/file2
- Delete/some/folder/file
- Backup /some/folder again
Both snapshots will show 1GB size and but the total repo size will be 2GB, because the two snapshots contain different 1GB of data each, something that stats cannot show you because of deduplication.
We need diff, not stats:
In general, in order to know what “grew” your repo from 1GB to 2GB you’ll need to look at the successive adds and removes, e.g.:
$ restic -r /path/to/restic -p restic-password diff --json ca88cb4e a54cb28f | \
    tail -n 1 | jq .
{
  "message_type": "statistics",
  "source_snapshot": "ca88cb4e",
  "target_snapshot": "a54cb28f",
  "changed_files": 144,
  "added": {
    "files": 19757,
    "dirs": 10077,
    "others": 0,
    "data_blobs": 32285,
    "tree_blobs": 11379,
    "bytes": 23458018099
  },
  "removed": {
    "files": 7,
    "dirs": 0,
    "others": 0,
    "data_blobs": 213,
    "tree_blobs": 1396,
    "bytes": 110409411
  }
}
In my case, in snapshot a54cb28f, about 22GB got added.
With recent restic versions, a snapshot now contains statistics on how much data was uploaded when saving the snapshot (field data_added_packed which is visible using either restic cat snapshot <id> or restic snapshots --json). So, it’s relatively easy to extract how much data a snapshot added to the repository.
Hi,
Thanks for your answer. I didn’t know that. This is great (and probably a lot faster).
However it only works until restic forget starts deleting intermediate snapshots. Four months from now, when I only have monthly backups left for the time around $(date), restic cat snapshot <id> will still have the amount of growth when that snapshot was created and to see the difference between the two monthly snapshots, one would still have to resort to restic diff.
But I guess one could store the output of restic snapshots --json over time and then later calculate the diff between the monthly backups by summing up the additions of the intermediate backups. Trading storage space for a little execution speed. But it wouldn’t be accurate. If the data backed up by two consecutive monthly snapshots was completely identical the actual storage requirement for the second monthly snapshot would be 0. But in between, there could well be data added and removed again, so that just summing up incremental sizes *resulting in declaring > 0 storage space for the second monthly backup) would give an indication but would ultimately be inaccurate.
Diffs are not accurate either, actually. Say that I take daily backups of /folderA and /folderB. The data doesn’t change at all in either folder.
After a couple of days I’d have snapshots from backing up both as in:
aaaaaaaa  2025-07-24 00:00:00  draper                  /folderA
bbbbbbbb  2025-07-24 00:00:00  draper                  /folderB
cccccccc  2025-07-25 00:00:00  draper                  /folderA
dddddddd  2025-07-25 00:00:00  draper                  /folderB
eeeeeeee  2025-07-26 00:00:00  draper                  /folderA
ffffffff  2025-07-26 00:00:00  draper                  /folderB
The snapshots a… and b… take up space in the repo, the but later ones don’t.
While the diff between e… and f… is large, the diff between d… and and e… is zero. So just diffing between one snapshot and the next is not accurate.
Now one could say that we group snapshots by directories. Then we’d (correctly) see that the increases for all snapsots c… and after is zero. But if I move a (large) file from /folderA to /folderB, between e… and f…, the actual repo increase is 0, but such a grouping would show a large diff for between d… and f… .
So I still don’t really know how to measure “how much did the repo increase because of this snapshot”? Other than actually doing du -sb <repo> (or whatever is appropriate for your storage backend) after each backup and each forget. And storing the results.
Actually, there is a way. Here is how to see the collective usage of the first 4 snapshots:
$ SNAPSHOTS=$(restic -r /repo -p /pass snapshots --json | \
    jq -r '.[].short_id' | head -n 4)

$ restic -r /repo -p /pass stats --json --mode=files-by-contents $SNAPSHOTS
{"total_size":3548103559,"total_file_count":6410,"snapshots_count":4}
And then do that for the first snapshot, the first two, the first three, etc. This is not the fastest approach, but should be accurate:
O( nSnapshots^2 * snapshotSize)
If restic stats had an option to print out the cumulative size after each snapshot, that would eliminate having to do it muliple times, and reduce that to:
O( nSnapshots * snapshotSize)
@pmorch I didn’t get what information you are really looking for, to be honest.
If it is “how much did the repo increase because of this snapshot?” then the answer of @MichaelEischer (or looking at log of the backup output) is exactly what are you looking for.
The main problem IMO lies in the fact that “how much did the repo increase because of this snapshot?” is not the same as “how much repo space could be freed by removing this snapshot?”. And that the question “how much space in the repo is occupied by this snapshot?” cannot be answered unless you provide an exact (mathematical) definition of “occupied”.
However, it seems that many people are mixing these questions or try to answer one by answering another one, because they are not aware of the differences.
So, what are we really talking about here?
I’ll try to be as clear as I can: I want to see which of my current snaphots cause the total repo usage that I currently have.
As I wrote in the stack exchange post about BTRFS that I linked to above, this is a usage graph from a Synology NAS that does it beautifully:
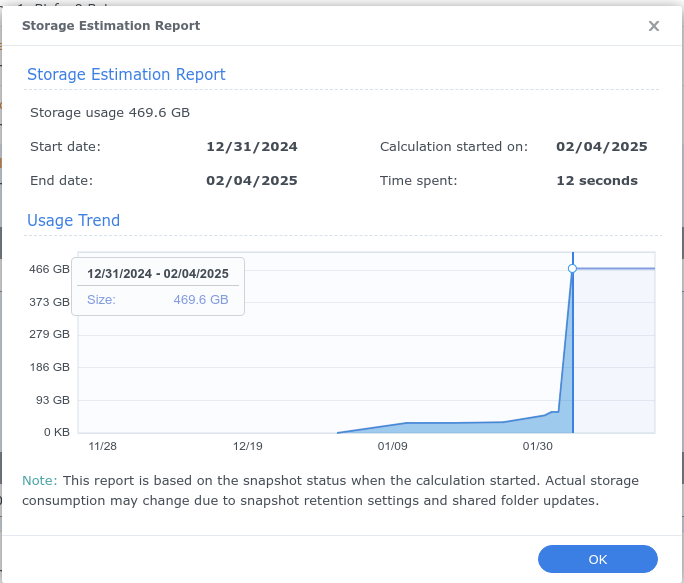
It starts with the first snapshot (ordered by time) and for each successive snapshot, it shows how much extra space is required to store it, relative to the first snapshot which is at y=0. (I might have started the y-axis at the size of the first snapshot myself, but that is a minor issue.)
If we imagine this was a graph of current restic snapshots, it would’ve shown that the snapshot for 12/31 introduces about 400GB of new data to the repo. It might actually have been introduced to a snapshot a little earlier and then “forgotten” in the meantime.
@MichaelEischer’s answer would not have told me this if the new data got introduced on 12/30 in a since-forgotten snapshot. The snapshot on 12/31 may not have grown the repo at all when it was made. But now it does represent growth, as the oldest snapshot currently to contain this new data.
To me this is a (“the”?) perfect visualization of space usage by my current snapshots.
Does anybody find any fault with it? Anything that could be improved? Any alternatives that are better?
So you’re basically suggesting to attribute the costs for storing a data blob to the oldest snapshot that references that blob.
What do you expect that metric to tell you? From what I understand you’d learn what was the first snapshot that added a certain amount of data. But what can you do with that information? It feels like it’s mostly relevant at the point in time that triggered some unexpected backup size increase. But for that the data_added_packed information in the snapshot might be sufficient. The metric will barely help in efficiently hunting down snapshots that still contain some unexpected data.
So you’re basically suggesting to attribute the costs for storing a data blob to the oldest snapshot that references that blob.
I agree completely.
What do you expect that metric to tell you? From what I understand you’d learn what was the first snapshot that added a certain amount of data. But what can you do with that information?
First of all, if I’m the only one thinking this is a great way of looking at it, perhaps it isn’t such a great idea. If you all think it is a bad idea, I’ll leave it be for now.
Personally, I use ths graph to answer “When did my restic repo grow from X to now Y?” Large step-increases in repo size or slow constant slopes are great to answer that. “Oh yeah, in January I started immich and now backup X GB of photos also”. Or “Wait, why did it increase so much day before yesterday?” - A restic diff later: Oh, a google-takeout.tgz and a unpacked folder of the same data also… Then I know to move that data to somewhere that isn’t backed up, and restic rewrite the snapshots removing that large unintended data.
To me this is the way of looking at size increase for btrfs and restic that makes the most sense and is most actionable. I’m surprised it doesn’t make sense to everybody. But hey… ![]()
I haven’t had a problem with the size of my restic repositories so far, so I’m not particularly sure what information would be relevant or not. If a metric is basically only useful for checking the repository size development over time but not for cleaning up, then that’s also important to know when trying to decide which metrics are useful enough and which aren’t.
And unfortunately the various repository size calculations have various limitations each such that there’s no obviously best one. So, I’m primarily trying to understand what a new metric could provide. In particular, as any metric that isn’t precomputed will take quite a lot of time.