Hi.
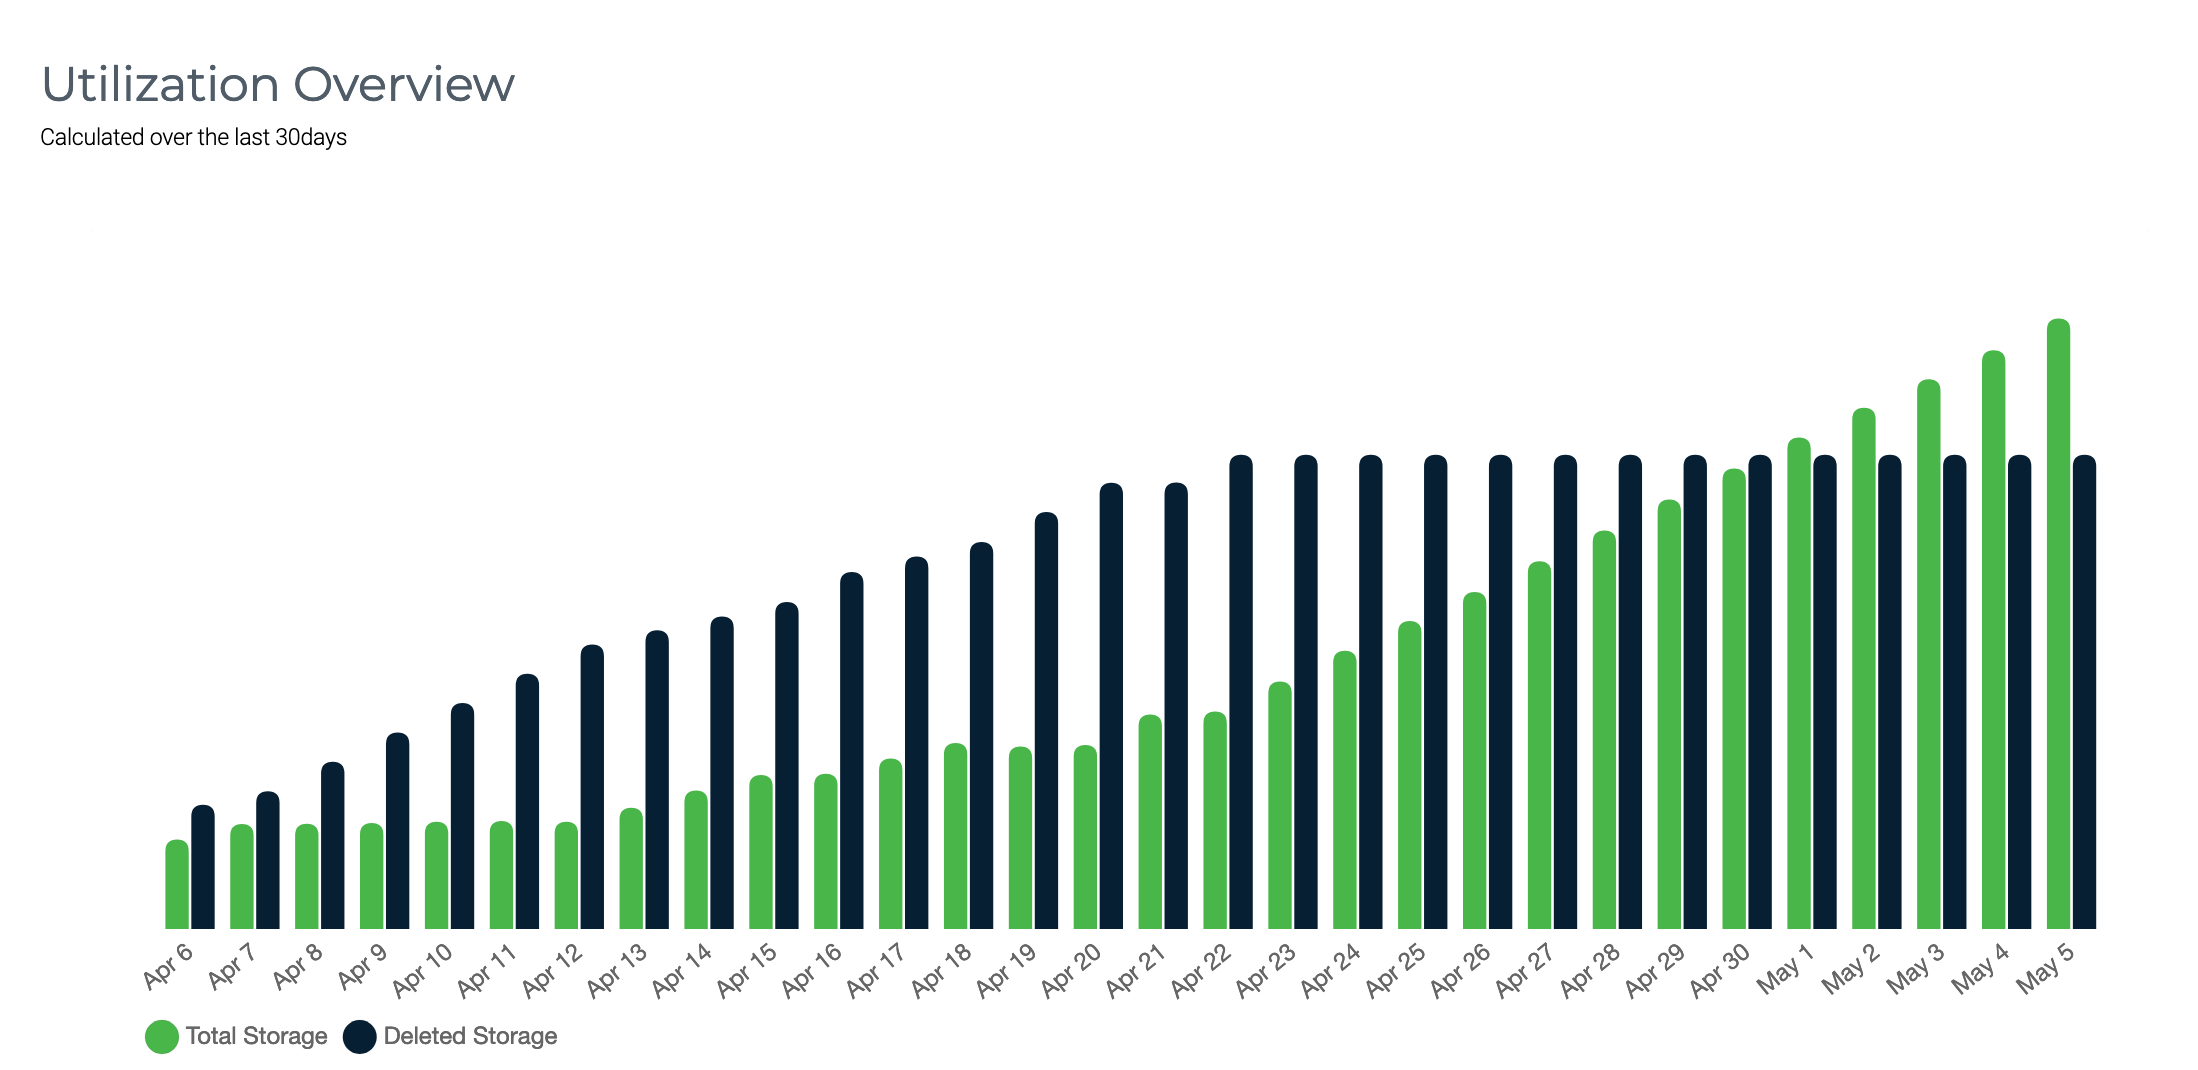
I’m using Restic with Wasabi (S3 compatible). In the bills and in the usage graph I noticed a rather high rate of deleted data. I was wondering if it’s normal.
As Wasabi bills data deleted before 90 days I’ve set up my retention policy to --keep-monthly=12 --keep-within 90d since at least a couple of weeks (was different before).
Nonetheless, there’s still a lot of deleted data daily. I.e. in this bucket for a raw size of 65G there are 50G of deleted data daily.
I’m posting below the usage graph of the bucket and the billing summary of last weeks.
This bucket is used by a single webserver only. The server holds 12G of data on disk (web files and uncompressed and compressed mysql dumps). The daily added data might be correct, but I wonder why there’s so much deleted if there’s no forget/purge.
Thanks
# restic version
restic 0.9.5 compiled with go1.12.4 on linux/amd64

# restic stats
repository 7db89e03 opened successfully, password is correct
scanning...
Stats for all snapshots in restore-size mode:
  Total File Count:   7005991
        Total Size:   999.116 GiB

# restic stats --mode raw-data
repository 7db89e03 opened successfully, password is correct
found 1 old cache directories in /root/.cache/restic, pass --cleanup-cache to remove them
scanning...
Stats for all snapshots in raw-data mode:
  Total Blob Count:   101923
        Total Size:   59.134 GiB
While writing I was wondering if Wasabi is considering deletes across all account and not on this repo only, but seems weird in terms of graph and reporting.
| StartTime | EndTime | NumBillableActiveStorageObjects | NumBillableDeletedStorageObjects | RawActiveStorageBytes | BillableActiveStorageBytes | BillableDeletedStorageBytes | ||||||
|---|---|---|---|---|---|---|---|---|---|---|---|---|
| 2021-05-04T00:00:00Z | 2021-05-05T00:00:00Z | 11910 | 11227 | 62003838424 | 62007373901 | 55361500812 | ||||||
| 2021-05-03T00:00:00Z | 2021-05-04T00:00:00Z | 11615 | 11224 | 60460726342 | 60464173320 | 55361488524 | ||||||
| 2021-05-02T00:00:00Z | 2021-05-03T00:00:00Z | 11343 | 11221 | 59045733446 | 59049098250 | 55361476236 | ||||||
| 2021-05-01T00:00:00Z | 2021-05-02T00:00:00Z | 11071 | 11218 | 57647924347 | 57651206977 | 55361463948 | ||||||
| 2021-04-30T00:00:00Z | 2021-05-01T00:00:00Z | 10794 | 11215 | 56205570132 | 56208769213 | 55361451660 | ||||||
| 2021-04-29T00:00:00Z | 2021-04-30T00:00:00Z | 10502 | 11212 | 54688408245 | 54691519652 | 55361439372 | ||||||
| 2021-04-28T00:00:00Z | 2021-04-29T00:00:00Z | 10207 | 11209 | 53173090739 | 53176113647 | 55361427084 | ||||||
| 2021-04-27T00:00:00Z | 2021-04-28T00:00:00Z | 9918 | 11206 | 51656054213 | 51658990272 | 55361414796 | ||||||
| 2021-04-26T00:00:00Z | 2021-04-27T00:00:00Z | 9625 | 11203 | 50156578243 | 50159426353 | 55361402508 | ||||||
| 2021-04-25T00:00:00Z | 2021-04-26T00:00:00Z | 9340 | 11200 | 48666377813 | 48669140174 | 55361390220 | ||||||
| 2021-04-24T00:00:00Z | 2021-04-25T00:00:00Z | 9068 | 11197 | 47250518025 | 47253198212 | 55361377932 | ||||||
| 2021-04-23T00:00:00Z | 2021-04-24T00:00:00Z | 8783 | 11194 | 45798112596 | 45800707034 | 55361365644 |
(I’ve upgraded to 0.12 now)